Working with json data in pandas can be painful, especially in a resource constrained environment such as a Kubernetes cluster. In particular as data size increases, implementation differences for routines such as expanding a json string colum to several columns can make a huge difference in resource usage (CPU and memory).
The challenge
I was recently working with data extracts in json format, provided as zip compressed files in an Azure blob storage container. The extract contained nested user data, such as
{"userId": "XYZ", "attributeA": "abc", "attributeB": "def", "dataScope": "{\"countryId\": \"DE\", \"attributeC\": \"ghi\", ...}"}
The challenge with this data is that the dataScope field encodes its json data as a string, which means that applying the usual suspect pandas.json_normalize right away does not yield a normalized dataframe. pandas.json_normalize does not recognize that dataScope contains json data, and will therefore produce the same result as pandas.read_json.
The workflow that processed the data was inspired by StackOverflow, which expanded the dataScope column and concatenated it eventually with the original dataframe:
def json_to_series(text: str) -> pd.Series:
    keys, values = zip(*[item for item in json.loads(text).items()])
    return pd.Series(values, index=keys)

def main():
  # ... other stuff ...

  expanded_datascope = df['dataScope'].apply(json_to_series)
  df = df.drop(columns=['dataScope'])
  result = pd.concat([df, expanded_datascope], axis=1)

  # ... other stuff ...
This worked fine initially, when the extract was uncompressed about 60 MB (a few hundred KB compressed size). But then the extract size increased to the size of 420 MB (uncompressed, compressed size about 9 MB, mind you). And the Kubernetes workflow failed (out of memory).
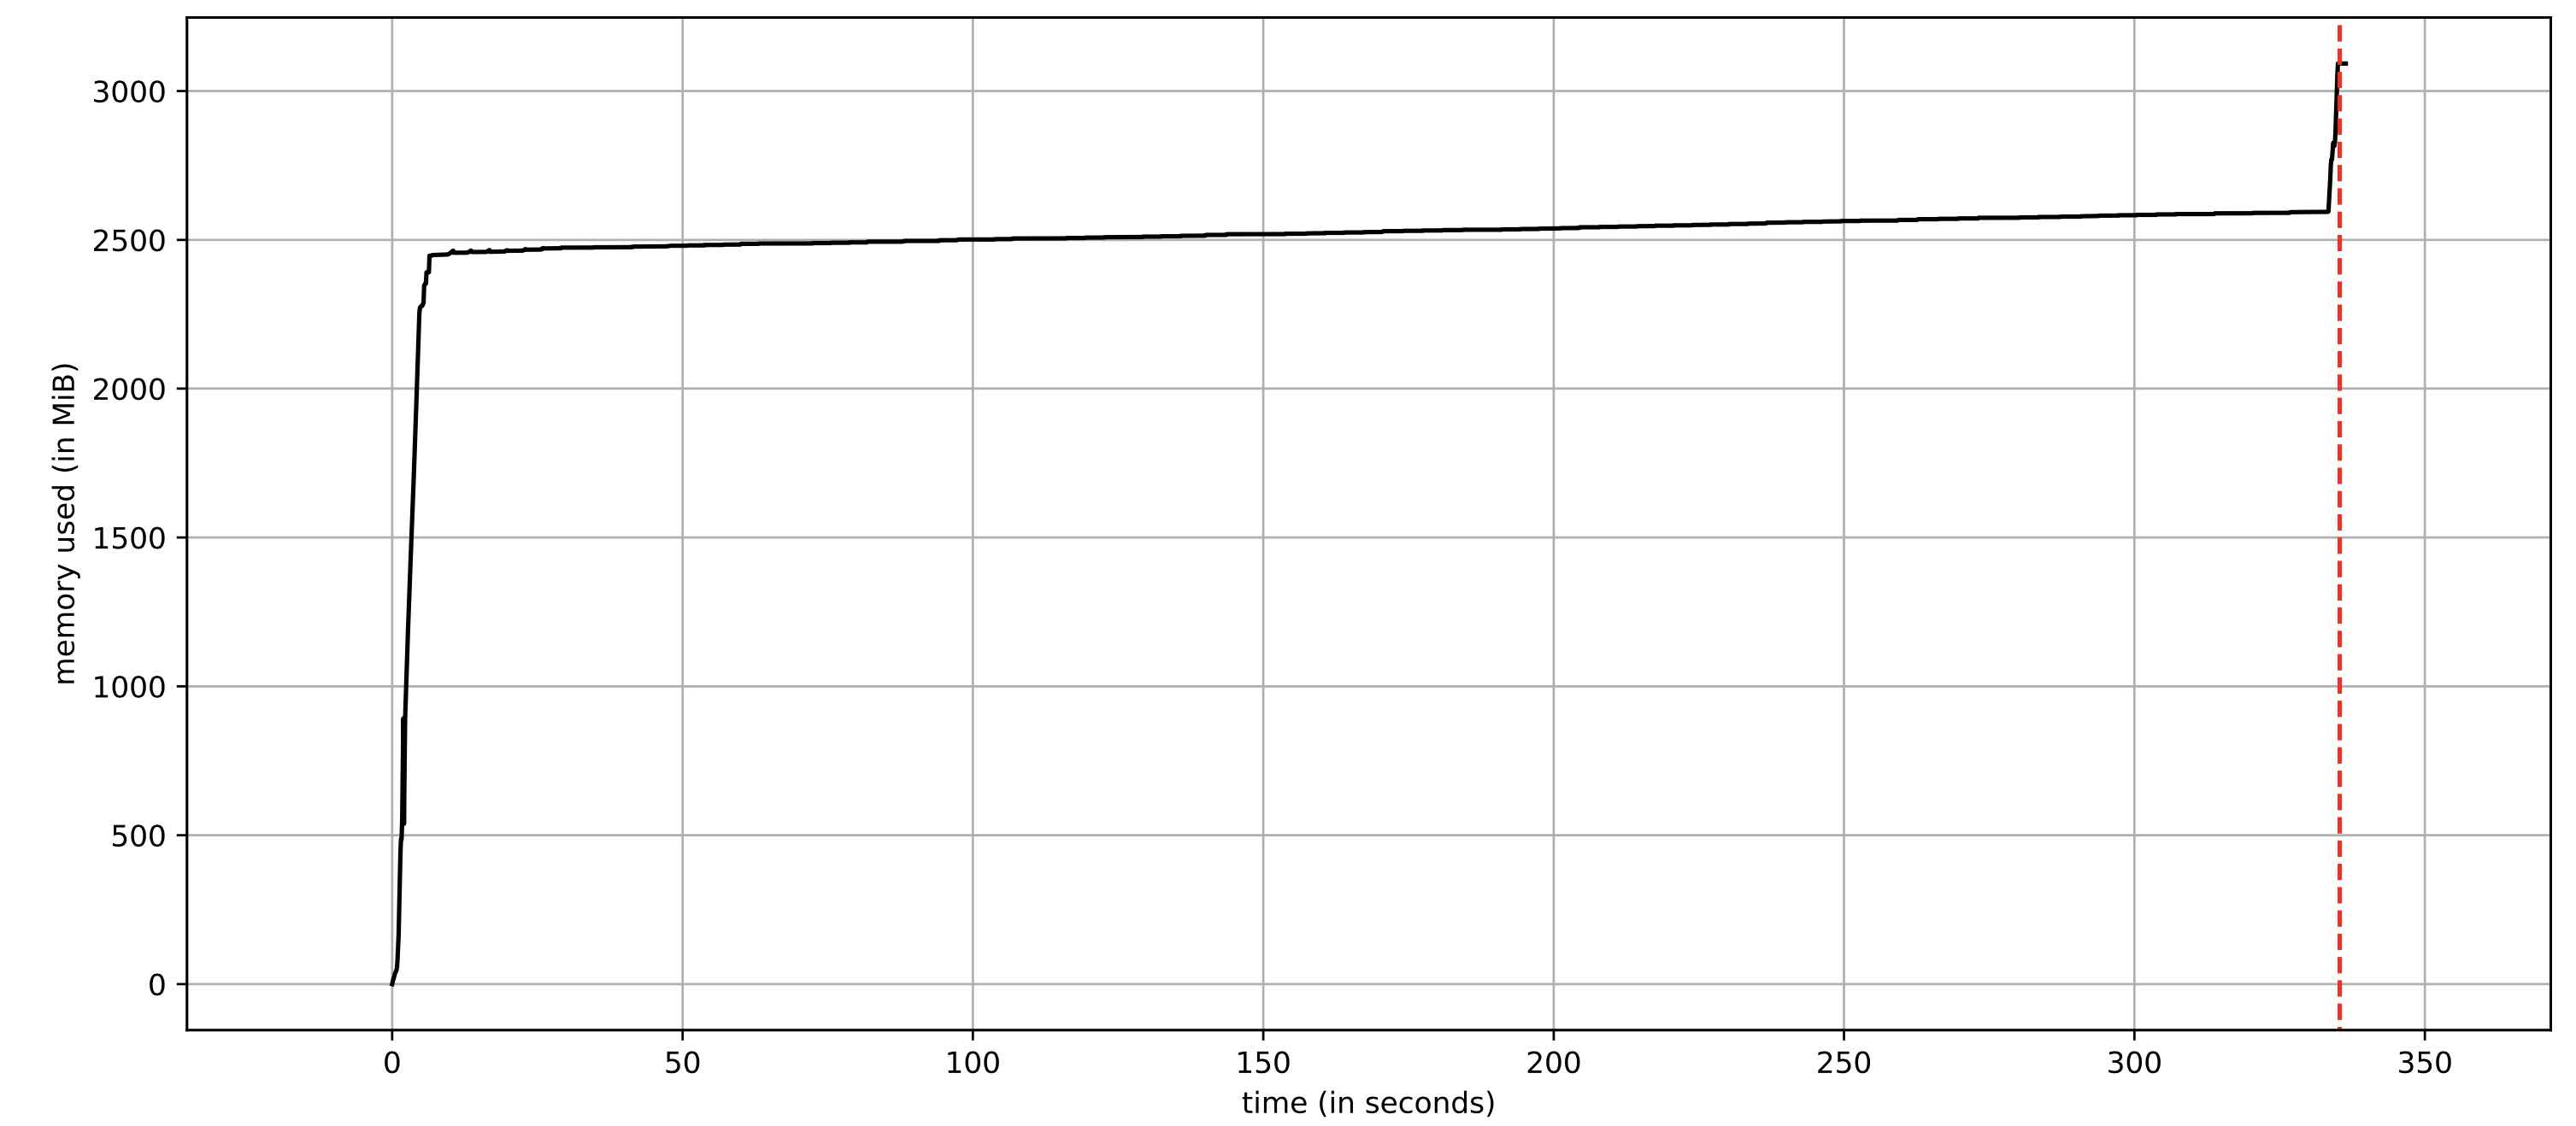
To record memory usage over time, we can use the utility mprof of the memory_profiler module1. In preparation, we remove anything from the workflow code that is not related to json loading, expanding, and assembling the final dataframe into a separate script called performance_tests.py (we suspect these steps to be the culprits). We then run mprof run python performance_tests.py and plot the result via mprof plot -f. As can be seen below, the memory consumption for loading less than 500 MB json data into a pandas dataframe, expanding a string json column into many, and concatenating it with the original dataframe takes more than 8 GB memory! ![]() Why does this happen?
Why does this happen?
![Memory consumption over time for the original routine `df['dataScope'].apply(json_to_series)`](/assets/images/2021-06-04-pandas-memory/memory_consumption_v1.jpg)
df['dataScope'].apply(json_to_series). The plot was created using the utility mprof.
Into the rabbit hole
Besides recording the memory usage over time, memory_profiler also allows us to record the memory increment per line of code (coming at the cost of increased runtime) by first decorating the function to be profiled with @profile and then running the profiler via python -m memory_profiler performance_tests.py. (Do not forget to remove the decorator after profiling, since otherwise your script will not run…)
In the output, shown as extract below,
Line #    Mem usage    Increment  Occurences   Line Contents
============================================================
...
27   82.707 MiB    0.000 MiB           1     with open('data.zip', 'rb') as f:
28   91.402 MiB    8.695 MiB           1       data = f.read()
29
30   91.457 MiB    0.055 MiB           1     with zipfile.ZipFile(io.BytesIO(data), mode = 'r') as zipdata:
31   91.457 MiB    0.000 MiB           1       files = zipdata.infolist()
32   91.457 MiB    0.000 MiB           1       assert len(files) == 1, "Zip file is expected to only contain one file"
33   91.484 MiB    0.027 MiB           1       with zipdata.open(files[0].filename) as f:
34 2475.801 MiB 2384.316 MiB           1           df = pd.read_json(f)
35 2475.801 MiB    0.000 MiB          11     df.columns = map(lambda s: s[:1].lower() + s[1:], df.columns)
...
45 7043.602 MiB 4569.082 MiB           1     expanded_datascope = df['dataScope'].apply(json_to_series)
62 7041.660 MiB   -1.941 MiB           1     df = df.drop(columns=['dataScope'])
63 7041.664 MiB    0.004 MiB           1     result = pd.concat([df, expanded_datascope], axis=1)
we see that loading the json data into a pandas dataframe already takes more than 2 GB memory, even though the dataframe itself is less than 600 MB (run df.info(memory_usage='deep')). This is an unfortunate property of pandas and can only be improved on when running pandas.read_json in a separate process, which is not straightforward to do. The main memory increment comes through the line df['dataScope'].apply(json_to_series), though.
(Note that there is quite a gap between the measurements via mprof vs. memory_profiler in this case. I am not sure why, I suspect memory_profiler is missing something here. For the remaining measurements below, both approaches are consistent with each other.)
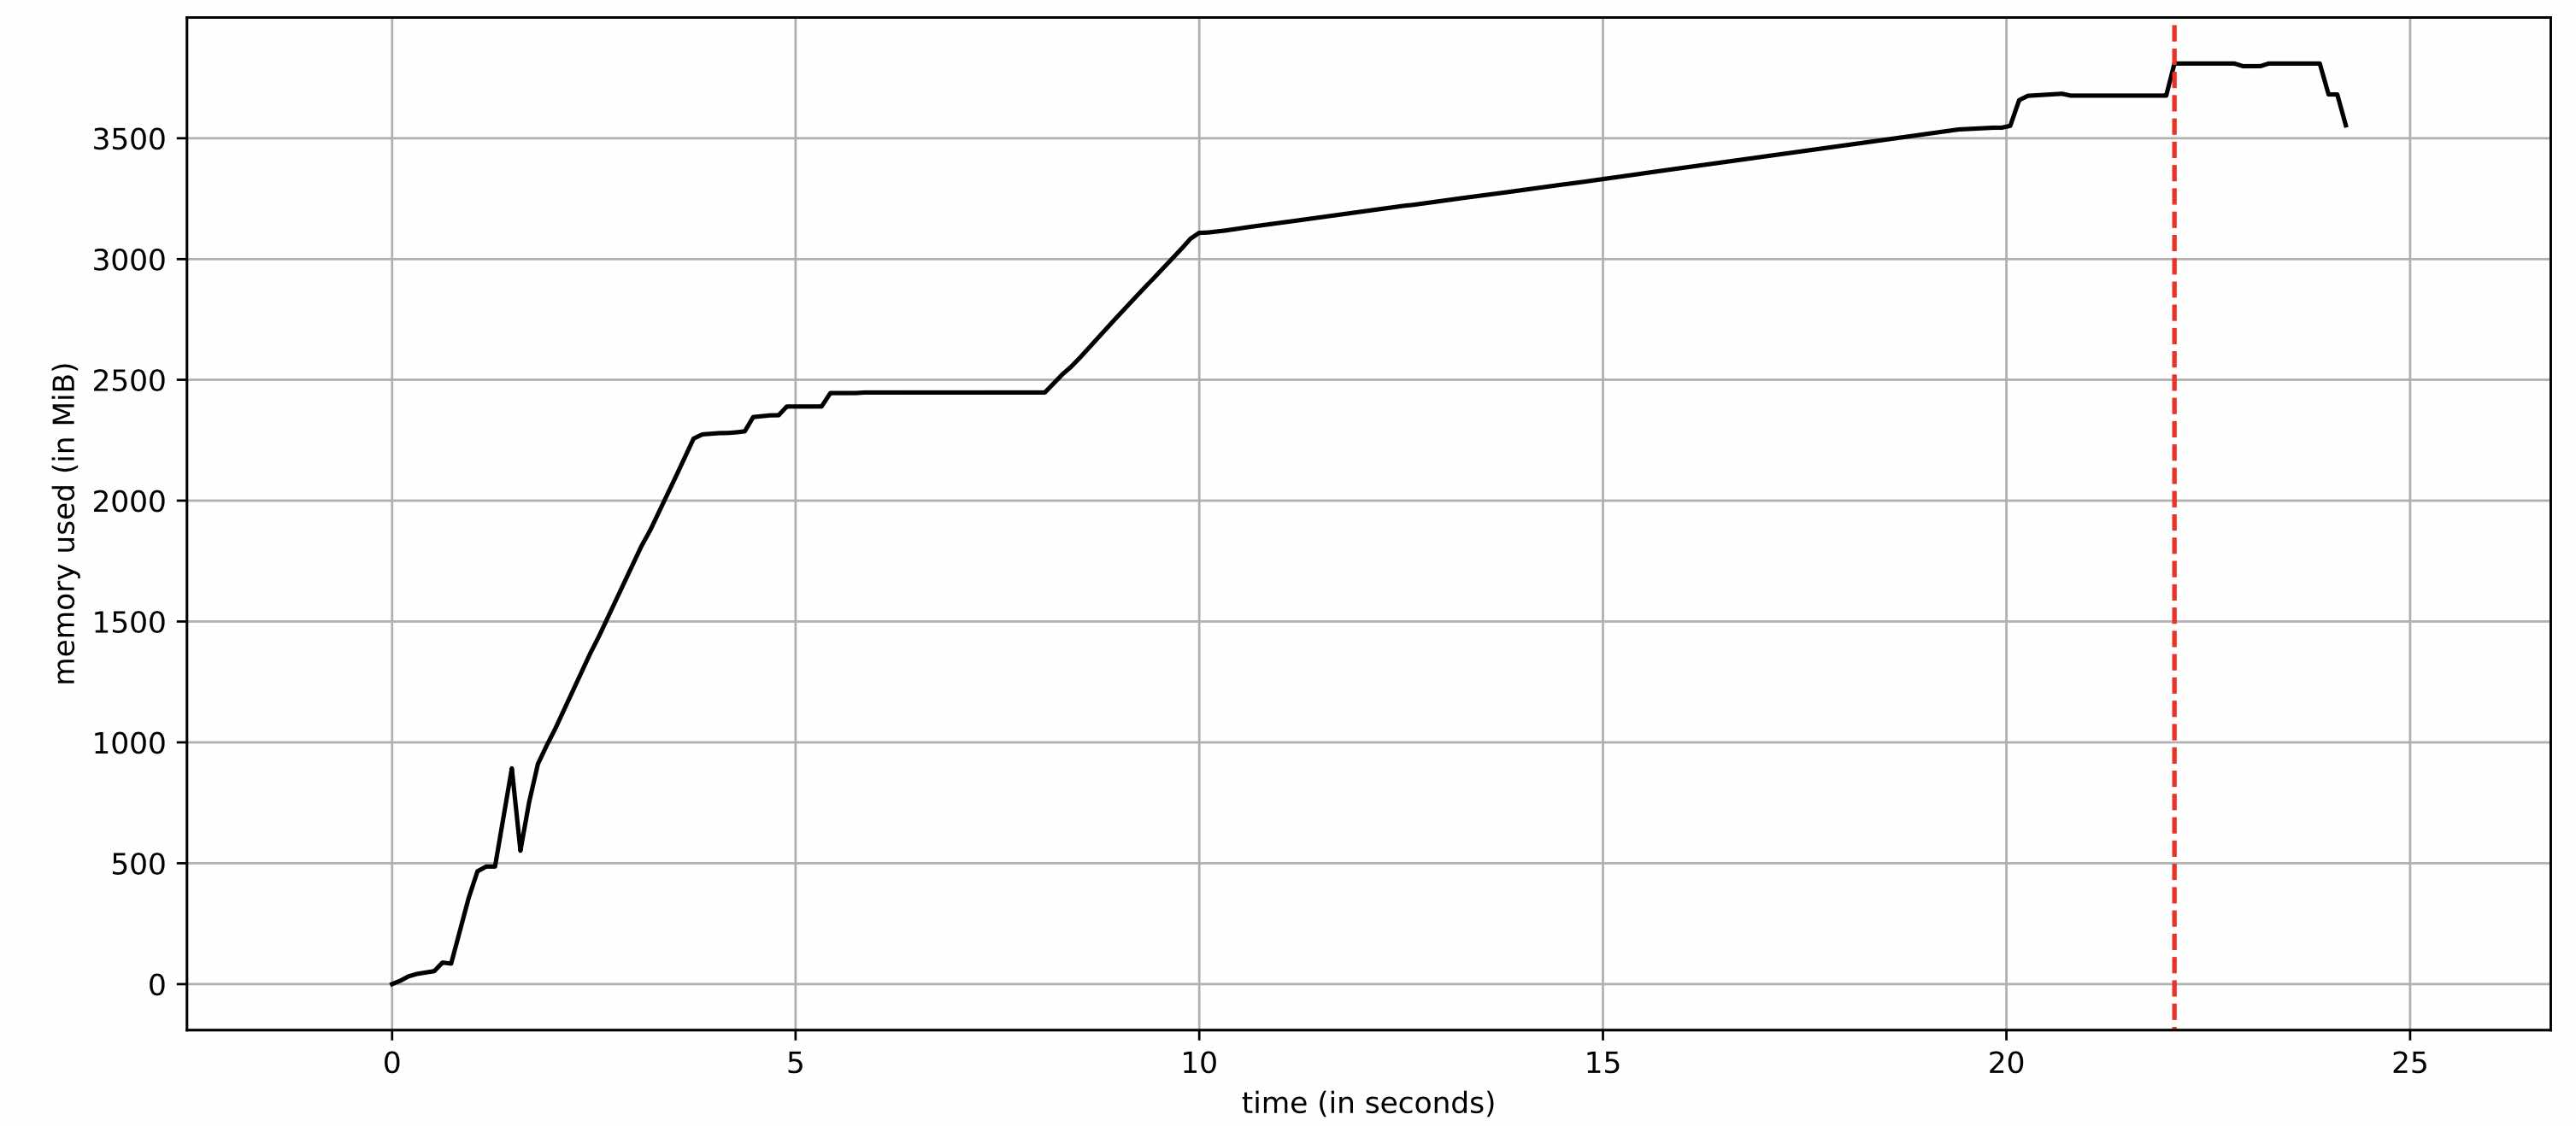
Why is df['dataScope'].apply(json_to_series) so memory-hungry (and inefficient, I might add - a runtime of more than 5 minutes is not quite mind-boggling)? First, creating an object such as pandas.Series is expensive - it involves type checks, index creation, and the creation of a memory block. This explains the slow runtime. Second, a Series object itself is not a slim data structure itself: comparing the memory consumption of a Series object (.memory_usage(index=True, deep=True).sum()) to the memory consumption of the corresponding dictionary object (sys.getsizeof()), we find the latter to be a factor of two smaller. But the most important factor seems to lie in the inefficiency of growing data structures (in this case, numpy arrays) during the .apply call. There are two indications for this: there are about 10x as many calls to numpy.array than rows in the dataframe2, and splitting the routine in smaller pieces replacing expanded_datascope = df['dataScope'].apply(json_to_series) by
for ind in np.array_split(df.index, 100):
    expanded_datascope.append(df['dataScope'].iloc[ind].apply(json_to_series))
    expanded_datascope = pd.concat(expanded_datascope, axis=0)
reduces the total peak memory footprint to around 3 GB while having no negative impact on the runtime at all (instead, it slightly reduces the runtime).
json_to_series in batches. The plot was created using the utility mprof.
This is a curious, but important takeaway: performing calculations that involve resizing of large, “complicated” objects is not a good idea, neither is using a memory-heavy object in pandas .apply.
While solving the memory issue via “divide and conquer”, i.e., applying json_to_series in batches provides a fix for the memory consumption, it is not a particularly satisfying solution: to work well, it requires tuning the number of batches, and it is slow. Can we do better?
The answer suggests itself: we could use a leaner data structure, namely a dict - the smallest data structure flexible enough to accommodate semi-structured data where we can’t expect all keys to be present in each row.
Consequently, let’s rewrite expanded_datascope = df['dataScope'].apply(json_to_series) as
expanded_datascope = df['dataScope'].apply(json.loads)
expanded_datascope = pd.json_normalize(expanded_datascope)
and see how it fares:
json.loads and subsequently pandas.json_normalize. The plot was created using the utility mprof.
![]() We not only significantly reduced the memory footprint, but also reduced the runtime from about 340s to about 24s (factor 14!). By looking a the memory increment for those two lines we can verify that the memory reduction is due to our changes:
We not only significantly reduced the memory footprint, but also reduced the runtime from about 340s to about 24s (factor 14!). By looking a the memory increment for those two lines we can verify that the memory reduction is due to our changes:
48 3133.129 MiB  657.309 MiB           1     expanded_datascope = df['dataScope'].apply(json.loads)
49 3821.852 MiB  688.723 MiB           1     expanded_datascope = pd.json_normalize(expanded_datascope)
But can we do even better? From a memory perspective, hardly. (Apart from e.g. first loading the json as dataframe, saving the dataframe in an efficient format, e.g. parquet, and loading this file instead of the raw json data for further processing - this would allow us to remain below 2 GB total memory usage.) From a performance perspective, we can. While pandas.json_normalize is already a rather efficient implementation, we can improve on json.loads by using the faster implementation orjson.loads. This way, we can reduce the runtime by a few seconds: Using the line_profiler module, we can verify that the line df['dataScope'].apply(json.loads) accounts for about 12% of the total runtime, while only for about 2% when replacing it by df['dataScope'].apply(orjson.loads).
Conclusion
This real-world example provided above illustrates that using .apply with a bloated python function can not only hurt from a performance point of view, but also have a severe impact on memory usage. In particular when working with cumbersome objects such as json strings, choosing lean data structures is vital for writing efficient code.
-
For more information on profiling python applications, see e.g. Gorelick, Micha and Ian Ozsvald. “High Performance Python.” (2014). ↩
-
This can be seen by running the profiler
cProfileviapython -m cProfile -o output.stats performance_tests.pyand inspecting the profile report e.g. viaimport pstats; p = pstats.Stats("output.stats"); p.sort_stats("ncalls"); p.print_stats(20). ↩